


EU HRC TRQ tightens for Türkiye, Vietnam
EU hot-rolled sheet tariff-rate quota (TRQ) utilisation for the second quarter shows Türkiye and Vietnam drawing down their quotas by 22 April, following the earlier exhaustion and oversubscription of India’s allocation, Kallanish notes.
In volume terms, Türkiye has seen the largest quota drawdown among origins with remaining availability at only 24%, while Vietnam is the tightest within the “other countries” allocations, with just 2% available.
As of 22 April, Türkiye had 96,662 tonnes remaining from its 398,355t allocation. India’s country-specific quota is fully exhausted, with no balance or available volume left. Vietnam had just 2,466t still available.
Among other major suppliers, South Korea retains substantial availability, with 134,726t, or 84%, still open. The United Kingdom and Serbia have 94% and 90% of their quotas still available, respectively.
Within the “other countries” pool, utilisation was mixed. Besides Vietnam, Algeria also showed notable utilisation, with 38% remaining, while Egypt has 67% and Taiwan 64% available. Japan remained still open at 93%, while Switzerland, the United States, Libya and Canada were effectively untouched.
| Origin | TRQ volume | Balance | Awaiting allocation |
Avaliable TRQ tonnes |
Available TRQ % |
| Türkiye | 398,355 | 103,346 | 6,684 | 96,662 | 24 |
| India | 225,306 | – | – | – | – |
| South Korea | 161,305 | 134,785 | 59 | 134,726 | 84 |
| United Kingdom | 139,411 | 131,685 | 3 | 131,601 | 94 |
| Serbia | 142,521 | 130,377 | 1,492 | 128,885 | 90 |
| Other countries: | |||||
| Egypt | 111,491 | 74,225 | – | 74,225 | 67 |
| Vietnam | 111,491 | 36,495 | 34,029 | 2,466 | 2 |
| Japan | 111,491 | 103,150 | – | 103,150 | 93 |
| Taiwan | 111,491 | 71,128 | – | 71,128 | 64 |
| Australia | 111,491 | 86,071 | 1 | 86,070 | 77 |
| Switzerland | 111,491 | 111,446 | 1 | 111,445 | 100 |
| United States | 111,491 | 111,484 | – | 111,484 | 100 |
| Libya | 111,491 | 111,491 | – | 111,491 | 100 |
| Canada | 111,491 | 111,491 | – | 111,491 | 100 |
| Algeria | 111,491 | 42,052 | – | 42,052 | 38 |
Source: EU TARIC, as of 22 April. Complied by Kallanish
Author: Elina Virchenko

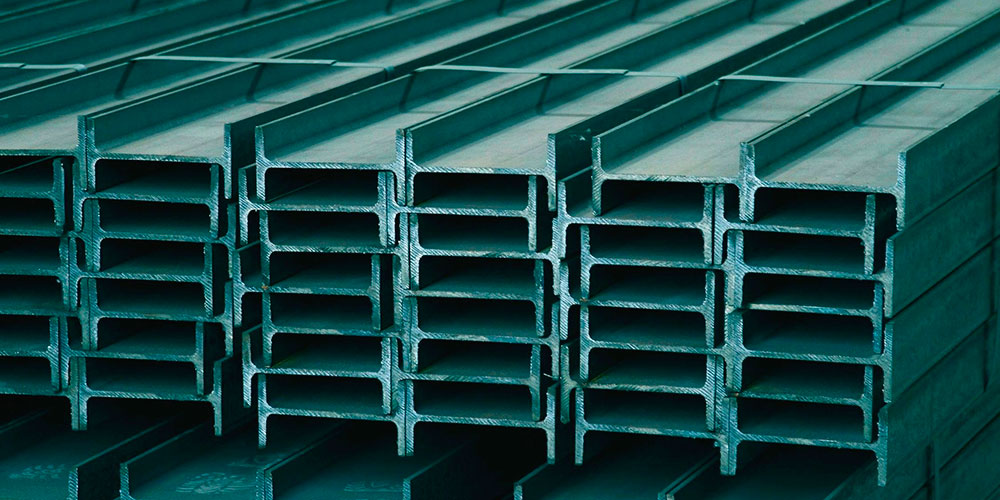
Türkiye, China lead EU’s second-quarter longs TRQ drawdown
EU long steel tariff-rate quota (TRQ) utilisation for the second quarter as of 22 April shows the heaviest drawdown concentrated in a limited number of origins, particularly Türkiye and China. Most UK-origin quotas remain largely open, Kallanish notes.
Across the four key long product categories – merchant bar, rebar, wire rod, and angles and sections – the largest absolute quotas are held by the UK in wire rod, China in merchant bar, and Türkiye in rebar and angles/sections.
By 22 April, the most pressured quotas were Turkish wire rod (100% used), Chinese merchant bar (90% used), Turkish rebar (75% used), and Egyptian rebar (92% effectively committed on a net basis). By contrast, UK-origin quotas across multiple longs segments remain largely open.
For merchant bar (category 12), China has an allocation of 140,406 tonnes. However, it is also the most actively used major quota, with only 14,570t still available, equivalent to 10% of the original volume. This implies around 90% utilisation. By contrast, the UK retains 97% availability and Türkiye 73%.
In rebar (category 13), Türkiye has a 94,493t quota, of which 23,711t or 25% is left. Among other origins, Egypt is also heavily utilised, with only 2,109t available, or 8%, once awaiting allocations are deducted. Bosnia and Algeria remain effectively unused.
Wire rod (category 16) shows the most aggressive drawdown of all longs categories. Türkiye has fully exhausted its 98,153t allocation, leaving zero balance. The UK has the largest quota at 163,136t, with 90% still available, while Switzerland retains 88%. Among other countries, Egypt is de facto exhausted with just 53t net available, while Malaysia, Bosnia, Korea and Indonesia remain largely untouched.
For angles and sections (category 17), the UK holds the largest country-specific allocation at 27,208t, with 99% still unused. Türkiye shows the highest effective utilisation, with 13,632t remaining from a 22,643t quota, meaning about 40% has already been consumed. Other origins such as the United Arab Emirates, China and Korea show minimal activity.
| Origin, product/category | TRQ volume | Balance | Awaiting allocation |
Avaliable TRQ tonnes | Available TRQ % |
|
| Merchant bars, category 12 | ||||||
| China | 140,406 | 16,076 | 1,506 | 14,570 | 10 | |
| United Kingdom | 117,300 | 114,710 | 484 | 114,226 | 97 | |
| Türkiye | 106,082 | 77,796 | 541 | 77,255 | 73 | |
| Switzerland | 68,179 | 64,704 | 140 | 64,564 | 95 | |
| Other countries | 60,752 | 53,927 | – | 53,927 | 89 | |
| Rebars, category 13 | ||||||
| Türkiye | 94,493 | 23,711 | – | 23,711 | 25 | |
| Bosnia and Herzegovina | 33,994 | 33,932 | – | 33,932 | 100 | |
| Moldova | 28,411 | 27,963 | 44 | 27,919 | 98 | |
| United Kingdom to Northern Ireland | 2,157 | 1,822 | – | 1,822 | 84 | |
| Other countries: | ||||||
|---|---|---|---|---|---|---|
| Egypt | 27,596 | 8,109 | 6,000 | 2,109 | 8 | |
| Algeria | 27,596 | 27,596 | – | 27,596 | 100 | |
| Wire rod category 16 | ||||||
| United Kingdom | 163,136 | 149,161 | 2,368 | 146,793 | 90 | |
| Switzerland | 115,202 | 102,670 | 954 | 101,716 | 88 | |
| Türkiye | 98,153 | 0 | 0 | 0 | 0 | |
| Moldova | 59,078 | 57,260 | 43 | 57,217 | 97 | |
| Other countries: | ||||||
| Malaysia | 15,090 | 15,016 | – | 15,016 | 100 | |
| Algeria | 15,090 | 12,593 | – | 12,593 | 83 | |
| Egypt | 15,090 | 1,053 | 999 | 53 | 0 | |
| Bosnia and Herzegovina | 15,090 | 15,066 | – | 15,066 | 100 | |
| Korea | 15,090 | 15,090 | – | 15,090 | 100 | |
| Japan | 15,090 | 14,358 | 218 | 14,139 | 94 | |
| Indonesia | 15,090 | 15,090 | – | 15,090 | 100 | |
| Serbia | 15,090 | 14,354 | 247 | 14,107 | 93 | |
| Angles, sections category 17 | ||||||
| United Kingdom | 27,208 | 26,816 | – | 26,816 | 99 | |
| Türkiye | 22,643 | 13,632 | – | 13,632 | 60 | |
| Korea | 5,277 | 5,210 | – | 5,210 | 99 | |
| United Kingdom to Northern Ireland | 14,100 | 13,006 | – | 13,006 | 92 | |
| Other countries: | ||||||
| China | 4,968 | 4,795 | – | 4,795 | 97 | |
| Switzerland | 4,968 | 4,968 | – | 4,968 | 100 | |
| United Arab Emirates | 4,968 | 4,538 | – | 4,538 | 91 | |
Source: EU TARIC, as of 22 April. Complied by Kallanish
Author: Elina Virchenko